Google Analytics is a free tool, provided by Google, which allows you to measure the traffic to your website – and so much more!
Google Analytics is an important asset in any SEO company’s arsenal, or for business owners who are looking to understand their website visitors. Google has provided webmasters and SEO service experts with the means to make sense of the internet and take the reins of their online data.
There is so much fantastic data available for website owners to use, to understand their website traffic and improve performance. So how do you get started? We have put together the top ways to get the most out of your Google Analytics account.
Why do I need Google Analytics?
First things first, why do you need Google Analytics? Simply put, it’s a way to:
- measure who visits your website;
- where they come from and;
- how they’re interacting with your website.
That’s obviously the very basics of Google Analytics. You can also view what country your website visitors are in, what browser they use, what device (i.e. mobile, tablet or desktop) they’re using, and which pages are the most popular. It’s also an essential tool when conducting an SEO audit, identifying any potential website shortfalls. To name just a few of the awesome perks!
We came to White Chalk Road with patchy websites, bad copy and no online plan. Within 6 months, White Chalk Road have us sorted out with fantastic website, consistent branding and proven results. We have passed more and more of our online marketing to the team as the ROI has surprised us. Wouldn’t hesitate to recommend that anyone use White Chalk Road if they need help in the online space.
James Corbitt, General Manager at Summerstar Tourist Parks
How do I add Google Analytics to my website?
If you’re not at all tech-savvy, this is where I would suggest getting your web developer and/or your digital marketing expert to help.
The best and most advanced way to add the Google Analytics tracking code to your website is through Google Tag Manager (GTM). GTM is another free tool from Google, that will provide you with a lot of flexibility in terms of adding tracking codes and event tracking to your website (i.e. tracking clicks on buttons, phone numbers, email addresses, etc.). You can even add structured data through GTM!
For those of you who are asking someone else to set this up for you, ensure they set up your Google Analytics and GTM accounts under your Google login so that if you wish to move from that provider at any point in time, you can without the hassle of the account being attached to them. It should be 100% owned by you and with you for life!
WCR pro tip: You can use the Tag Assistant by Google chrome plugin to ensure all tags/tracking codes have been put in the recommended spot by Google. If they aren’t in the right spot, this can skew or cause issues with your data.
How do I set up Google Analytics admin?
Once you have your account, you want to ensure everything is configured correctly in the settings to make sure you always have the most accurate data possible. But don’t fret! A lot of the settings are fine to leave as the default.
We recommend reviewing the following settings:
- View Settings
- Property Settings
If you don’t understand what they are asking from you, you can simply click on the little help icon:
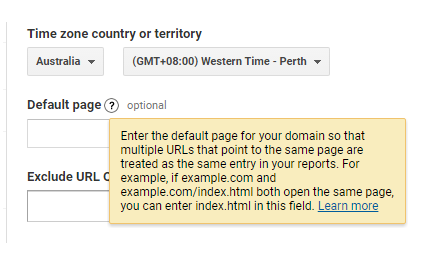
Of course, there are many more settings you can configure however we’d always recommend seeking a professional to help prior to changing too many settings.
If you do feel semi-confident and want a safety net, you can create a new view and test out changes in this view. It’s always best practice for anyone with a GOOGLE ANALYTICS account to create an ‘Unfiltered’ view so you always have access to your raw data. You can set up new Google Analytics views like this.
How to understand Google Analytics data
Now, this is where we get into the juicy part. What do you need to look at in the dashboard and what is it trying to tell you?
Home
The first screen you’ll typically land on is Google Analytics Home.
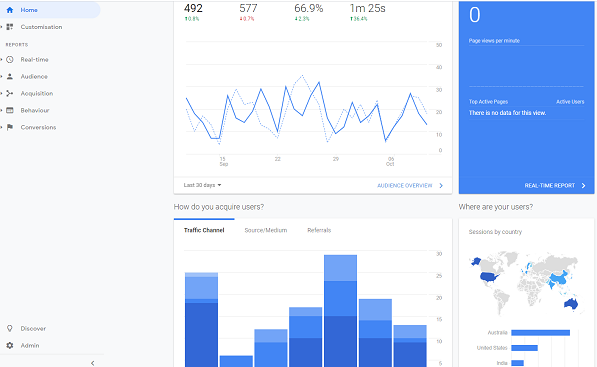
What you’ll see here:
- Last 7 days vs. 7 days prior in terms of traffic, bounce rate and session duration (scroll to the bottom of post for definitions)
- Most popular days and times
- Real-time view (who’s on your site right now)
- Traffic channels (i.e. do they come from Google or Paid Search, Social Media, Direct Traffic, etc.)
- Which country they are in and more!
The home screen is a great overview if you want some quick answers and to check everything is going well. For nearly all the stat boxes you can filter the date ranges too. By default, they’ll be set to 7 days.
Real-Time
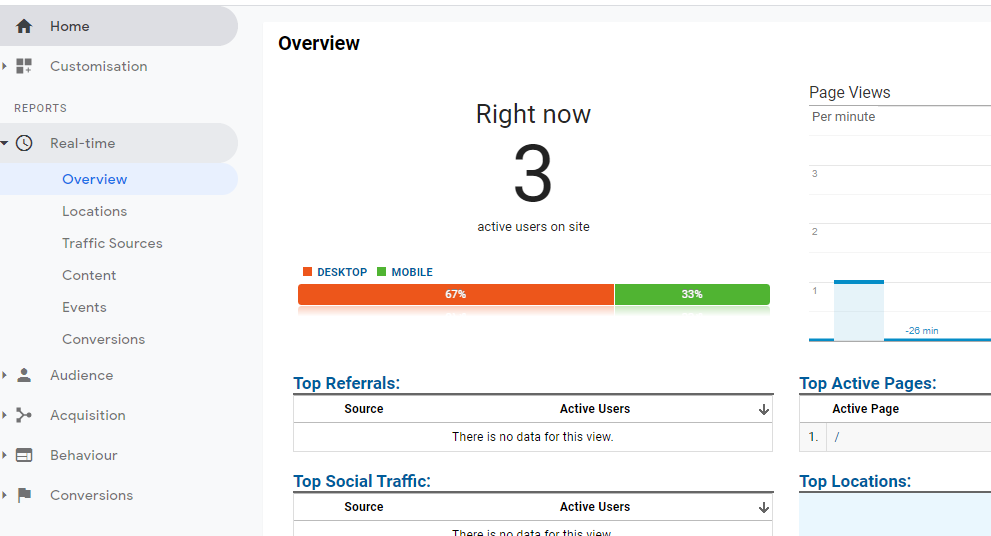
This is where the Google Analytics-obsessed live. This is where you will see the live traffic on your site what conversions are happening.
Audience
Now before we go any further. Remember that you can change the date range for the data you are viewing in the top-right-hand corner. If you’re analysing and making assumptions, it’s easier to look at a longer than shorter period so you have more data to work with.
Under this section you can learn things like:
- What countries/cities your website visitors are in
- Are they new visitors or have they been to your website before aka returning visitors
- What browser and network they are using
- If they are on a mobile device, tablet or desktop
To name but a few! We recommend spending a couple of hours going through each section and using the help icons to work out what may be useful to your business.
Acquisition
Being an SEO agency, this is where your Search Marketing Managers spend a lot of their time. It allows us to see how your organic traffic is performing against all the other types of traffic.
Under the All Traffic > Overview section you can see the data for each channel. If you want to dig further you can look under Referrals to see which other websites are sending people to your website. If you’re doing content and copywriting like guest posting, this is a great spot to keep an eye on.
Under the acquisition menu, you can also assess how your Google Ads campaigns are doing if you are utilising this form of online advertising. Plus, there are a few other sections that you may want to delve into if you want to dig deeper into social media traffic and such.
Behaviour
This section is all about what people are looking at on your website and how they are interacting with it. From finding out the most viewed pages and landing pages to how fast pages’ load – it’s all about the behaviour of your users.
Conversions
Your SEO Search Marketing Manager will ensure you have goal tracking set up in the admin section so you can track conversions on your website. These are key interactions with your website, such as submitting a contact form, click on your phone number or email address or perhaps downloading a PDF. We explain more about Goal tracking further down in this article.
Conversions are a key metric to track when it comes to assessing how well your website is performing and should always be a metric you keep your eye on. Gone are the days where keyword rankings were the best reporting stat. Keywords are of course an important part of an SEO Strategy but being a business owner you should focus on an integrated SEO strategy. Leave the keywords up to your SEO manager to worry about.
Some of the most popular Google Analytics terms and their meanings
You may find some of the words a bit strange in Google Analytics and even the explanation within the tool may not make a whole lot of sense, therefore here are some easy to digest definitions for those of us who like layman’s terms:
- Sessions: Basically, a website visit (geek tip: up until a couple of years ago they were called ‘visits’ in Google Analytics)– these are not unique, so the same user can visit your website multiple times a day and each time it’s counted as a new session.
- Users: A unique visitor and like the above they were actually called ‘unique visitors’ up until mid-2014.
- Bounce Rate: This is a percentage and is calculated based on the number of users who hit the site and then ‘bounce’ or leave from that page without visiting another page. So basically, the percentage of users who view only one page. A word of warning – this is a metric to take with a grain of salt and in the context of other factors.
- Average Session Duration: The amount of time a visitor spends during their session roughly. By default, the max can only be 30 minutes unless you alter this in the settings of Google Analytics. I must also mention that Google Analytics will only track a session duration up until the last interaction with the website. Therefore, if a user arrives on a page, spends 1 minute reading it and then bounces off, it will be recorded as 0 seconds. However, if they read the page for 1 minute and then download a PDF at the bottom which you have event tracking on, then it will be recorded as a 1-minute session duration.
Understand these 3 Google Analytics reports
We can’t emphasise enough how important it is for a business to understand its website analytics. By finding out things like where your visitors are coming from and what they’re looking at on your site you’ll be able to make smarter decisions when it comes to your online marketing strategy.
GA Report: How many website visitors do I get?
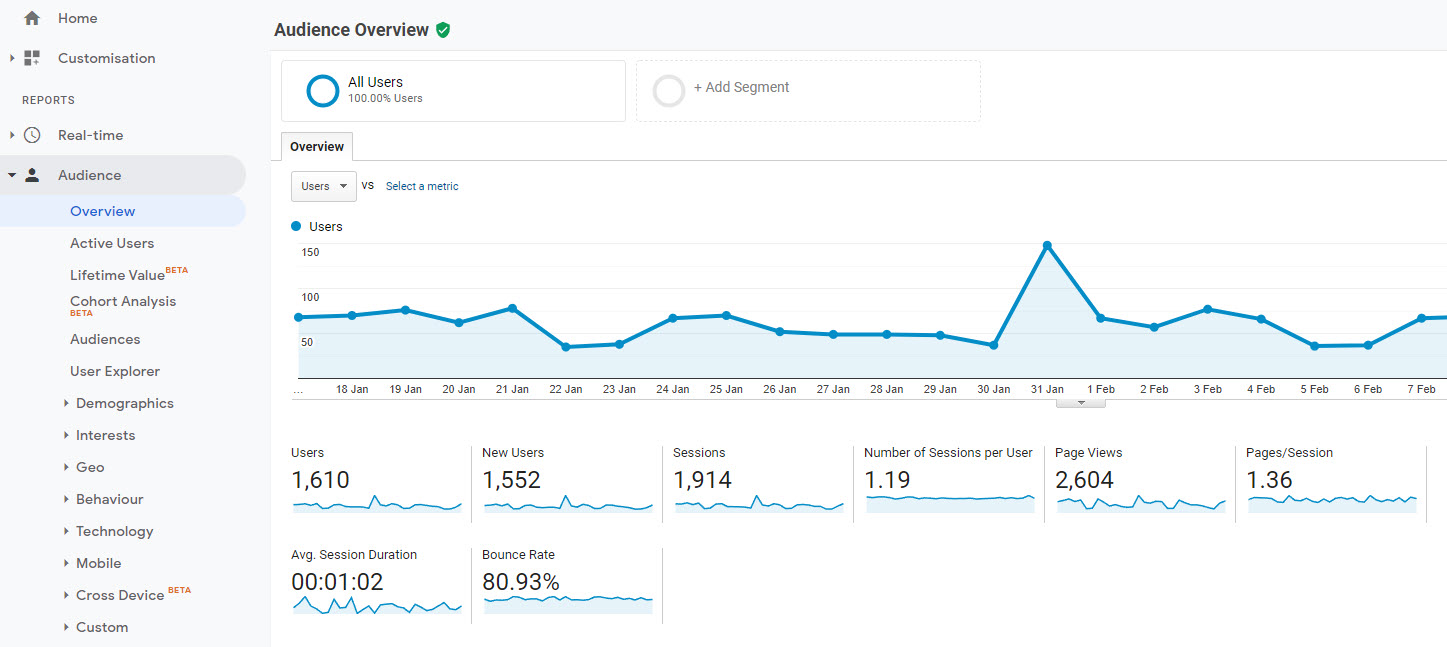
Audience > Overview
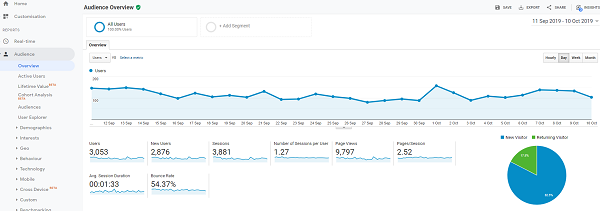
This report is typically the first page that’ll open after your login to your Google Analytics account. It’ll tell you the total number of sessions (total number of visits), users (unique visits), page views, pages/session, average session duration, bounce rate and the % of new sessions.
It’s a good report to get an overview of how much traffic your website is getting and under this section, you can also drill further down to user demographics, location of each user alongside things like what kind of device they’re on. It may seem a bit creepy knowing you had 10 visitors from Western Australia on your website today who were all on an Apple iPhone but as we say in the marketing game, the better you know your customer, the better you can position your brand.
GA Report: What online channel are my website visitors coming from?
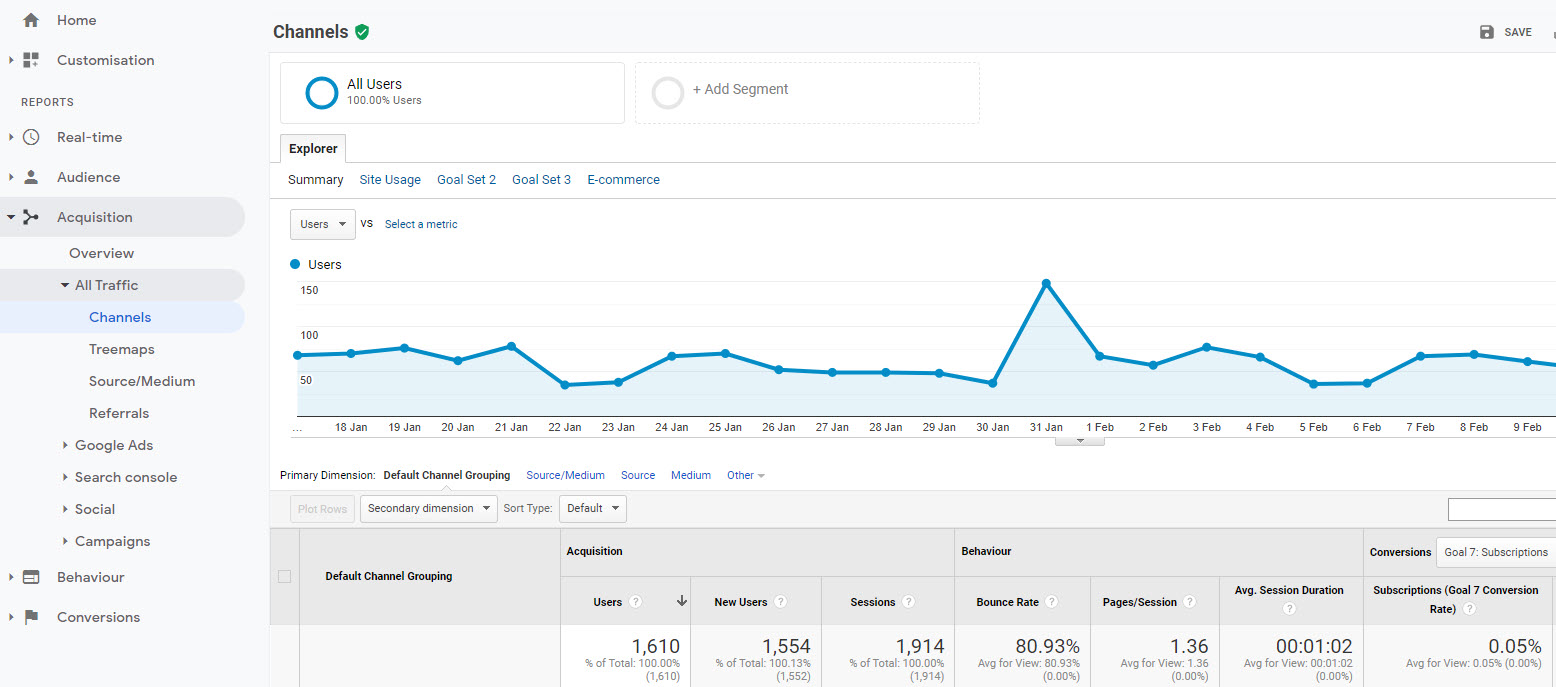
Acquisition > All Traffic > Channels
Do you think all your website visitors are coming from social media? This report can give you the facts. You might be surprised to see that very little traffic comes through from your social media channel when actually most of your visitors are coming from Google.
The Channels report will tell you how many of your visitors come from Google or other Organic Search engines (Yahoo!, Bing etc. are included here), it’ll tell you how many users come via Paid Search if you’re running AdWords campaigns, how many users come from Social media, how many users type your URL Direct into their browser if any other websites are sending Referral traffic via a hyperlink to your website and the number of people who come via Email blasts.
You’ll be able to see how long users from each of the above channels spend on your site, how many pages they view and if they’re new users. By analysing this report you may come to the conclusion that less time, effort and money should go into one channel and more into another.
GA Report: What are my website visitors doing on my site?
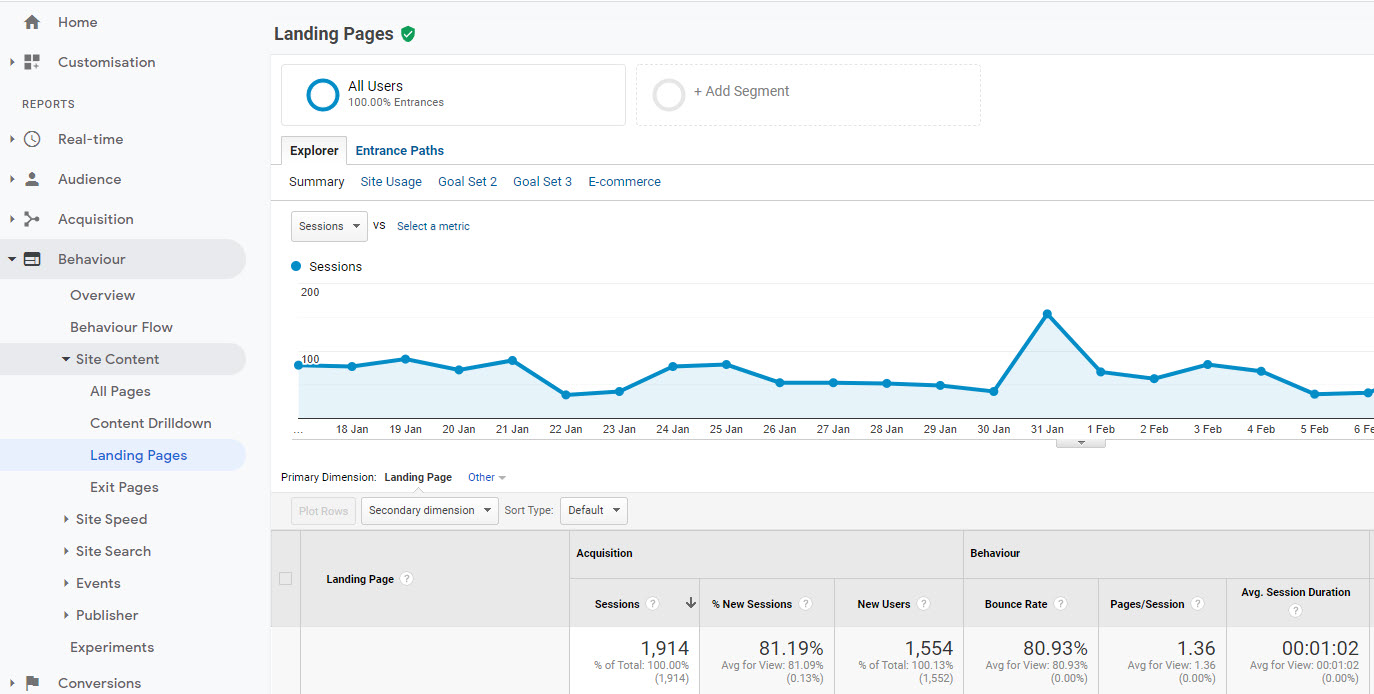
Behaviour > Site Content > Landing Pages
Firstly a landing page is a page through which visitors enter your website. Within this report you’ll be able to see what are the most visited pages, which are holding the user’s attention the most (average sessions duration) and whether visitors are sticking around to see more (pages/session) or are returning visitors (% new sessions). It’s also helpful to see how your blog article and SEO copywriting efforts are performing.
Sometimes small tweaks to pages can improve both bounce rate and the average session duration by making the page and its content more engaging and enticing. If you’re pushed for time, aim to look at one landing page per week and improve its content with these simple yet effective tips. Compare the pages which do have positive stats to those which don’t and look at why this could be.
Google Analytics goals
If you are trying to increase your conversion rate on your website, then one crucial resource that you should consider using is the Goals feature in your Google Analytics account. Goals can help you track how well each of your web pages is doing at converting prospects into customers for you. Despite the importance of defining goals for your website, many internet marketers are unaware of this function or how to use it.
Let’s take a close look at some of the most common questions about Google Analytics Goals.
What are goals?
When a web visitor lands on one of your web pages, you should have a specific action that you want that visitor to take.
Perhaps you want the visitor to sign up for your email list by entering his email address. Maybe you sell a product on your website, and you want your visitors to purchase it. Maybe you want them to download a free ebook or catalogue in PDF format that you offer on the site.
These are all goals that you might have for your website, and in each of these instances, you can set it up as a Goal within Google Analytics so that you can track how well your site is accomplishing it.
Why set up goals?
By tracking goals within Google Analytics, you’ll be able to get a much clearer picture of which aspects of your website are succeeding, and which aspects of it need some improvement.
When a visitor lands on a page, you will be able to see how often that visitor converts compared to other pages on your site. After tracking your goals for a bit, you will be able to see what’s working and what’s not.
Then you can replicate what is working, rather than wasting time building web pages that don’t actually convert. This also makes it much easier to run split tests on your web pages.
How do you set up goals?
To get started with setting up Goals, you will first need to log in to your Google Analytics account (or create one). Find the account name you want to set up goals for, then click on Edit under the ‘actions’ column on the right. You will now see your account settings, simply click on +add goal, and Google will begin to guide you through the process of setting up your first goal.
Currently, Google allows you to define up to 4 sets of goals, with 5 goals in each set. This means you can define a maximum of 20 goals, and you can define multiple steps inside each goal if you want to make a funnel. This should be enough for almost any website.
Goal types
There are three major types of goals that Analytics will let you track. These are a URL Destination Goal, a Time on Site Goal, and a Pages per Visit Goal. For tracking conversions, you will definitely find the URL Goal to be the most useful.
From your main page, you might track how often a customer clicks to a product page, then clicks to the order page, and then finally ends up on your thank you page. However, the other goal types can also be quite useful.
Goal sets
Google allows you to group your goals into as many as 4 different sets. This is useful if you have more than one type of conversion that you want to track. For example, you might have your email list signups in one Goal Set, and you might have your product sale Goals in another Set.
Which reports are available?
There are many reports available to you after you have set up your Goals and after you have allowed enough data to accumulate. You can see your conversion rate for each day and even the most common reverse path to your final goal.
Perhaps the most useful report is the Funnel Visualization report. This will allow you to see exactly where you are losing potential customers so that you can quickly correct any problem. We take a closer look at sales funnels further down in this article.
Want to improve your bottom line?
If you’re already receiving traffic to your website, but not the sales or enquiries you’d expect, it’s time to look at improving user-experience and boosting conversions with website conversion rate optimisation.
Site speed
The speed of your website will have a big effect on your SEO and visitors. If pages take too long to load then within a few seconds the user will quickly navigate away from your pages. People want to have information as quickly as possible, and this means that many will not have the patience to wait for your website to load when someone else’s can gratify them instantly.
Why is site speed important?
Google has made it their aim to help the Internet speed up, and they are doing this in several ways. Larry Page the co-founder of Google stated that he wished that the Internet was able to be as fast as it takes a reader to turn the pages of a magazine. This vision would mean no load up waiting times, instant streaming videos and a more functional Internet for everyone.
The search engine giant is trying to help by giving assistance to software developers to help them write scripts that will work faster, by helping ISP get to grips with the issues which are putting limitations on their network and by improving Google Analytics.
How to use Google Analytics to check if your site is up to speed
It’s all very well talking about the speeds, but not very useful unless they help to provide a way in which you can easily assess how fast your website and individual web pages load. This is the reason why Google Analytics has introduced the Site Speed Report in the Google Analytics platform.
In this section, you will be able to view the speeds that your pages load, counting from the moment the user clicks onto your site and the time it takes for the entire page to load fully.
What can you do with the information?
The Site Speed Report will allow you to see the speed times of your pages and check to see how the speed changes when the users are using different browsers. You will also be able to view the speed times in different geographical regions to see if various regions react slower compared to others.
Once you have all of the data you can then begin to break down your website to see what page is working, and which are not. You will be able to make sure that the landing page is performing well, and if there are problems you will need to try to find solutions by talking to your webmaster about possible solutions. This may well be something as simple as using fewer images or may require some careful scripting to enhance the speed.
With Google Analytics Site Speed Report you will be able to increase your websites conversion rates and deliver a more pleasurable experience for your users which will always be beneficial. And Google is hoping that this will just be the start in helping the Internet as a whole get up to speed.
Sales funnels
If you run an online business, then you are probably constantly trying to increase your traffic, improve your conversion rate, increase your number of sales, and ultimately increase your profits.
Although there are many ways to improve your business, most people overlook one of the most powerful tools available on the Internet. This tool is absolutely free and is provided by Google. It is available in your Google Analytics account, and it allows you to set up and track funnels. Let’s take a closer look at what funnels are, why they are important, and how to set them up.
What is a funnel?
A funnel is a series of steps or web pages that you want your Web site visitors to pass through toward your final goal. If you run an e-commerce site, then there is a good chance that your final goal is to make a sale. However, it is possible to set up funnels for other goals, such as opting into an email newsletter, downloading your ebook, or subscribing to your RSS feed.
A funnel gets its name from the fact that along each step there will be fewer and fewer Web site visitors, as they either leave your site or start doing something else.
For example, let’s say that you have a Web site that sells umbrellas. When a visitor arrives on your Home Page, your final goal is for him to purchase an umbrella. To do this, he first needs to go to the Product Page of one of your umbrellas. Then he needs to go to a Checkout Page where he enters his credit card and shipping information. Finally, his purchase is complete, and he arrives on your Thank You Page.
In this case, your funnel was 4 steps: Home Page -> Product Page -> Checkout Page -> Thank You Page. Notice that a visitor can drop off of this track at any point. You will always have more visitors at an earlier point in your funnel than at a later point.
Why setup funnels?
Many online business owners make the mistake of simply tracking the amount of traffic to their Web site and the number of products that they sold. From this, they determine their conversion rate. But note how little information this basic conversion rate gives them to actually improve their Web site.
Their best bet is to just change something at random and hope that their conversion rate improves. If you set up a funnel, then you will be able to quickly figure out the weakest part of your Web site.
How do you set up funnels?
Setting up funnels is easy. Simply go to the goals section of your Google Analytics account. Google currently allows you to set up to 40 goals, and each goal can have 10 funnel steps. This should be enough for all but the most complex Web sites.
Reviewing the results
You will need to let Google Analytics run for several days or weeks so that it can accumulate enough data to give you an accurate picture of how your Web site is doing. After enough data is accumulated, the real fun begins.
The most powerful report that Google offers is the Funnel Visualization report. This will show you the percentage of visitors that make it from one step to the next in your funnel.
For example, if 80% of your visitors pass from your Home Page to your Product Page, 70% of your visitors go from a Product Page to the Checkout Page, and 20% of visitors make it from the Checkout Page to the Thank You Page – then it is clear to you that you need to seriously work on improving your Checkout Page. You would have never known this without setting up a funnel.
eCommerce tracking in Google Analytics
If you run an e-commerce site, or even if you run any type of site in which you would like your visitors to complete an actionable goal like downloading an ebook or entering their email address, then Google Analytics E-commerce is definitely a tool that you should learn and know how to use.
This little-known tool is extremely powerful, and it can give you the valuable information that you need in order to improve your conversion rate and your increase your profits. Let’s take a closer look at why this tool is so important and how to get started using it.
Why enable eCommerce in Google Analytics?
If you are already using the Goal or Funnel functions in Google Analytics, then you are probably already well aware of how valuable they can be to track the data and behaviour of your Web site’s visitors.
However, those tools can only track things like page views and your conversion rate. While these are important, the Google Analytics Ecommerce function tracks something much more directly applicable to your business: revenue. Pageviews and conversion rates are sometimes abstract and difficult to understand, but revenues are much more concrete.
What data can be tracked?
The Google Analytics Ecommerce feature can track a wide variety of data. It is almost as if Google acts as an automatic accountant for your site. Here are some of the e-commerce data items that Google Analytics can track for you:
- Name of Product
- Category of Product
- Model of Product
- Product Quantity
- Product Unit Price
- SKU
- Purchaser’s Country
- Purchaser’s State
- Purchaser’s City
- Shipping Amount
- Tax Charged
- Total Price Charged
- Store Name or Affiliate ID
- Transaction ID Number
Tracking this data will give you a much clearer picture of how your business is doing and where the bulk of your sales are coming from.
How to setup eCommerce in Google Analytics
You may be wondering how Google could possibly know or be able to track such a wide variety of data for you. Although the initial setup can be tricky, it’s not that hard once you understand how it works.
When someone makes a purchase on your site, all this information is typically relayed to you through a form that the customer submits. The visitor tells you which product he wants, and then he pays for it with his credit card or other payment methods. Then, your Web site’s software generates a receipt to email him. At this point, a receipt in a format that Google Analytics understands will also be generated and automatically submitted to Google.
Basically, every time that you make a sale, you send Google Analytics a receipt with all the essential information. Google then stores and tracks all the data for you to come back and analyse later.
To get started with Google Analytics Ecommerce, you will need to log in to your Google Analytics account and edit the profile of the site that you want to track. You will notice an option that asks you whether your site is an eCommerce site. Click the radio button that says Yes, select your currency, and then save your profile.
Google currently can track 25 different currencies, so it should be able to handle your site even if you operate in several different countries. After you fill out the data items that you want to be tracked, Google will generate a JavaScript code for you to paste into your site.
What reports are available?
There are many interesting reports in the Ecommerce feature that are not available in other functions of Google Analytics. Two of these are the time to conversion and visits to conversion. It can be useful to know whether a visitor typically purchases your product on the first visit or on the second visit to your Web site.
If nearly all your visitors make a purchase the first time that they come to your site, then you know that you only have one chance to convert them into a customer. You can also display reports that are generated from user-submitted forms. For example, you might ask your site’s visitors what new products they would like to see on your site in the future and have Google Analytics keep track of the data.
Get started with Google Analytics today
Google Analytics is a powerful tool for all website owners it is essential to utilise this tool to measure and improve your website’s performance.
If you want a pro to help you interpret your Google Analytics data, make sure to get in touch with White Chalk Road. Our team are highly qualified when it comes to setting up and utilising all the features of Google Analytics, alongside being accredited Google Premier Partners.
Frequently asked questions about Google Analytics
To understand Google Analytics 4 you will need to speak to an online marketing professional, or read/view some online guide to show you throught the platform. Once you understand how Google Analytics 4 displays data you can see traffic, bounce rate, session duration, most popular days and times, traffic channels, countries and the real-time view.
Google Analytics 4 can take 24 to 48 hours to start tracking and processing data from your website or app, however it usually starts tracking as soon as you've placed it on the website. If it is not tracking within 48 hours, review the setup or speak to an SEO company to review what might be causing the tracking issue.
To view Google Analytics 4 you will need to set up the code on your website. We recommend firing the code with the help of Google Tag Manager. Once it is setup and firing on your website, log in to the Google Analytics 4 dashboard.


